Data
About Western Enrollment
All students, fall 2022
Headcount
All Students: 14,748
- Men: 6,266 (42.5%)
- Women: 8,482 (57.5%)
- Full-time: 12,938 (87.7%)
- Part-time: 1,810 (12.3%)
Undergraduate Headcount
Total: 13,946
- Full-time: 12,347 (88.5%)
- Part-time: 1,599 (11.5%)
Graduate Headcount
Total: 802
- Full-time: 591 (73.7%)
- Part-time: 211 (26.3%)
Enrollment Statistics
| All Students | Fall 2021 | % of Total for 2021 | Fall 2022 | % of Total for 2022 |
|---|---|---|---|---|
| Hispanic | 1596 | 10.6% | 1,566 | 10.6% |
| Hispanic Ethnicity | 578 | 441 | ||
| Hispanic & White | 782 | 887 | ||
| Hispanic & non-White | 236 | 238 | ||
| American Indian or Alaska Native | 270 | 1.8% | 232 | 1.6% |
| American Indian or Alaska Native Single Race | 68 | 58 | ||
| American Indian & White | 202 | 174 | ||
| Asian | 1,725 | 11.4% | 1620 | 11.0% |
| Asian Single Race | 963 | 869 | ||
| Asian & White | 762 | 751 | ||
| Black or African American | 491 | 3.2% | 500 | 3.4% |
| Black or African American Single Race | 281 | 292 | ||
| Black & White | 210 | 208 | ||
| Native Hawaiian or Other Pacific Islander | 72 | 0.5% | 72 | 0.5% |
| Native Hawaiian or Other Pacific Island Single Race | 20 | 27 | ||
| Native Hawaiian & White | 52 | 45 | ||
| International | 148 | 1.0% | 189 | 1.3% |
| Race and ethnicity unknown | 322 | 2.1% | 291 | 2.0% |
| Two or more races: Other | 188 | 1.2% | 181 | 1.2% |
| White | 10,313 | 68.2% | 10,097 | 68.5% |
| Total | 15,125 | 14,748 | ||
| Students of Color | 4,812 | 31.8% | 4,812 | 28.3% |
Student enrollment by place of origin
More detailed metrics can be found at the Office of Institutional Effectiveness
Inclusive Success
First-to-second Year Retention
Overall: 77.1%
Underrepresented Minority Students: 70.1%
Pell Grant eligible: 72.5%
Six-year Graduation Rate
Overall: 65.1%
Underrepresented Minority Students: 58.9%
Pell Grant eligible: 54.8%
Transfer Four-year Graduation Rate
Overall: 72.5%
Underrepresented Minority Students: 74.3%
Pell grant eligible: 69.1%
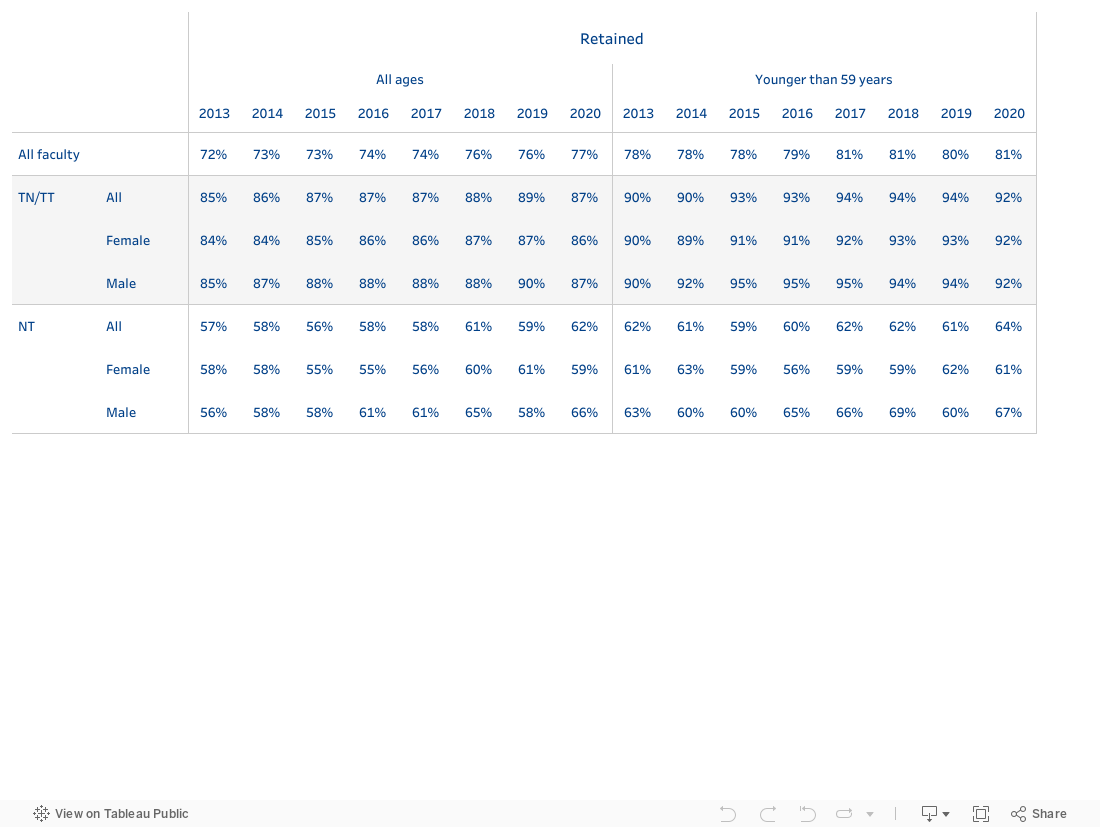
Faculty Retention Rates
The following are three year retention statistics, showing how many faculty employed in a given year remained employed three years later.
These data are broken down by Tenure Status*, gender, and Faculty of Color Status**.
TN and TT mean tenure and tenure Track. NT means non-tenure track.
Faculty retirements lower measured retention rates. To account for this, we also present the retention rates of faculty who are under the age of 59 on the hypothesis that faculty who leave WWU before 59 are not retiring. 59 has been used because it coincides with when people can start drawing from tax-deferred retirement accounts. This second table is potentially better at demonstrating the mobility of faculty for reasons other than retirements.
*Tenure status reported is the tenure status of the faculty member at the start of the three-year period.
**Faculty of Color are reported per IPEDS guidelines. Race categories include: American Indian or Alaska Native; Asian; Black or African American; Hispanic; Native Hawaiian or Other Pacific Islander; or two or more races.
Three-Year Faculty Retention Rates
Employee Demographics
| Employee type | Total WWU Employees | Women | Racial/Ethnic Minority | ||
|---|---|---|---|---|---|
| Faculty | 1016 | 533 | 52.46% | 248 | 24.41% |
| Staff | 1269 | 726 | 57.21% | 253 | 19.94% |
| Total | 2285 | 1259 | 55.10% | 501 | 21.93% |
Source of Data: Banner HR; WWU 2024 AAP for Women and Minorities (as of October 31, 2023), prepared by the Office of Civil Rights and Title IX Compliance. Data includes persons employed at any FTE.
Employees who self-identify as women and belonging to a racial/ethnic minority are included in numbers for both women and minorities. Racial/ethnic minority includes individuals who self-identified as: Hispanic or Latino; American Indian or Alaskan Native; Asian; Black or African American; Native Hawaiian or Other Pacific Islander; or Two or more races. Providing demographic information is voluntary. The totals and percentages in the above table do not include individuals whose demographic information is not available.
Faculty numbers include tenure track and non-tenure track faculty.